
Before using label comparison in the dashboard, labels must first be created and assigned to your keywords. Labels help you organize pages into meaningful groups based on campaigns, workflows, content types, optimizations, or experiments. So once labels are assigned, you can use them in the dashboard to compare different groups of pages side by side.
Labels allow you to go beyond a global view of your performance by focusing on specific groups of pages. In the dashboard, you can now analyse and compare performance across labeled pages making it easy to run A/B tests directly in your dashboard.
You can switch to the Compare per label view directly from the dashboard. This view allows you to compare up to 4 labels side by side.
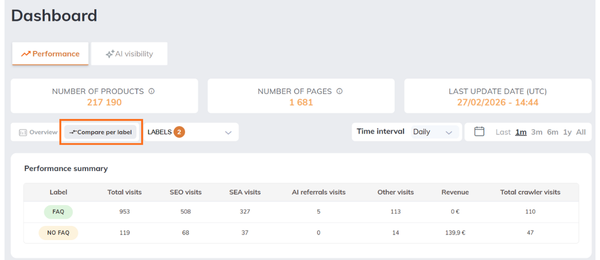
Each selected label is displayed as a separate line in the charts, making it easy to analyze differences in performance over time. A summary table complements the charts by providing a quick overview of key metrics such as visits or revenue for each label. For some charts, you can filter by traffic source (SEO, SEA, AI referrals, etc.).
This view is designed to help you identify which group of pages performs better.
How data is calculated #
When using label comparison, data is calculated based on the keywords assigned to each label on each specific date.
That’s why the number of Vpages (keywords) associated with a label can vary over time, depending on when labels are added or removed.
In each chart, hovering over a specific date displays a tooltip with detailed information for that day, including:
- The number of keywords associated with each label
- The corresponding metric for that date (e.g. visits or revenue, depending on the chart)
Important : If selected labels share common keywords, those keywords are counted in each label they belong to. This means that a single keyword can contribute to multiple label totals. As a result, metrics should be compared between labels, not summed across labels.
Examples of what to compare #
Label comparison is especially useful to measure the impact of your actions or to structure your analysis. Here are a few common use cases:
Content optimization #
Compare pages with and without a specific content improvement:
- With FAQ vs Without FAQ
- With cold content vs without cold content
This helps you understand whether your optimizations are improving traffic or revenue.
Campaign performance #
Track the performance of a specific campaign:
- Black Friday vs Regular pages
- Summer campaign vs Evergreen pages
You can quickly see how much traffic or revenue your campaign is generating compared to the rest.
Workflow and prioritization #
Evaluate the impact of your operational work:
- To optimize vs Optimized
- Reviewed vs Not reviewed
This helps measure whether completed actions are driving better results.
Testing and experimentation #
Run simple A/B-style comparisons:
- Layout A vs Layout B
By comparing these groups, you can identify which version performs best and guide your decisions.